PNG, 1,000 points
6.23 ms
matplotlib 131.82 ms
SVG export, 1,000 points
0.95 ms
matplotlib 116.29 ms
Cold process, plot, and save
146.30 ms
matplotlib 762.00 ms
End-to-end latency
Each bar is the measured latency for one scenario. The speedup column reports the matplotlib time divided by the Matplotvite time.
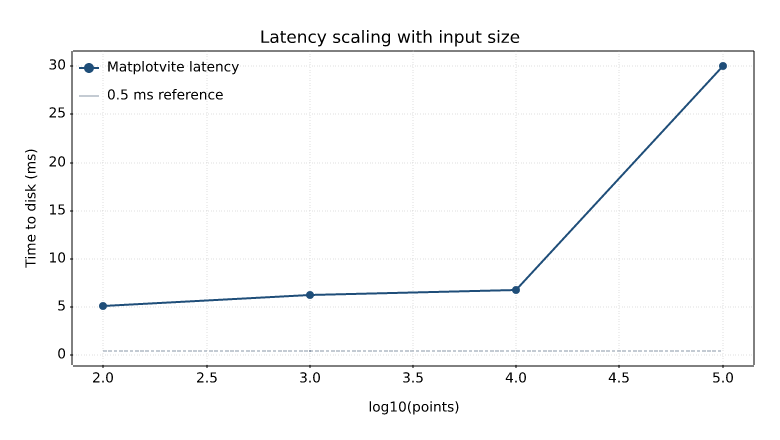
Latency versus input size
The scaling chart was rendered by Matplotvite itself. The x-axis is log10(points); the reference line marks 0.5 ms.
Benchmark matrix
| Scenario | Category | Points | Matplotvite (ms) | matplotlib (ms) | Ratio |
|---|---|---|---|---|---|
| Single Line (100 points, PNG) | Data Scaling | 100 | 5.11 | 161.48 | 31.6× |
| Single Line (1,000 points, PNG) | Data Scaling | 1,000 | 6.23 | 131.82 | 21.1× |
| Single Line (10,000 points, PNG) | Data Scaling | 10,000 | 6.78 | 137.12 | 20.2× |
| Single Line (100,000 points, PNG) | Data Scaling | 100,000 | 30.04 | 192.15 | 6.4× |
| Multi-Series (5 lines x 2,000 pts, PNG) | Complex Layouts | 10,000 | 13.74 | 197.95 | 14.4× |
| Subplots (2x2 grid, PNG) | Complex Layouts | 4,000 | 10.85 | 268.86 | 24.8× |
| Vector SVG Export (1,000 pts, SVG) | Vector Output | 1,000 | 0.95 | 116.29 | 121.9× |
| Cold CLI Execution (Process start + plot + save) | Startup & Process | 1,000 | 146.30 | 762.00 | 5.2× |
| Scatter (5,000 points, PNG) | Statistical | 5,000 | 11.27 | 276.89 | 24.6× |
| Bar chart (20 categories, PNG) | Categorical | 20 | 5.89 | 169.14 | 28.7× |
| Histogram (5,000 samples, PNG) | Statistical | 5,000 | 3.77 | 163.86 | 43.5× |
| Box plots (5 groups, PNG) | Statistical | 1,000 | 6.12 | 115.80 | 18.9× |
| Violin plots (5 groups, PNG) | Statistical | 1,000 | 8.63 | 128.59 | 14.9× |
| Filled contours (160x160, PNG) | Gridded | 25,600 | 34.49 | 108.65 | 3.2× |
| Image heatmap (160x160, PNG) | Gridded | 25,600 | 19.68 | 211.39 | 10.7× |
| Quad mesh (160x160, PNG) | Gridded | 25,600 | 14.65 | 170.96 | 11.7× |
| 2-D histogram (5,000 points, PNG) | Gridded | 5,000 | 18.13 | 108.57 | 6.0× |
| Hexagonal bins (5,000 points, PNG) | Gridded | 5,000 | 21.16 | 154.18 | 7.3× |
| Vector field (24x24, PNG) | Gridded | 576 | 26.44 | 147.92 | 5.6× |
| Datetime axis (365 points, PNG) | Data types | 365 | 11.60 | 124.00 | 10.7× |
| Vector PDF Export (1,000 pts, PDF) | Vector Output | 1,000 | 3.16 | 134.02 | 42.3× |
| Single Line (100,000 points, SVG) | Vector Output | 100,000 | 26.69 | 132.13 | 5.0× |
| Contour lines (160x160, 12 levels, PNG) | Gridded | 25,600 | 16.77 | 116.91 | 7.0× |
| Scatter (50,000 points, PNG) | Statistical | 50,000 | 26.16 | 145.35 | 5.6× |
| Repeated savefig (unchanged figure, PNG) | Repeated Output | 1,000 | 0.92 | 47.35 | 51.5× |
Implementation notes
The measurements reflect the current implementation, not a general guarantee. The main sources of difference are architectural:
Borrowed NumPy views
PyO3 reads contiguous NumPy buffers through borrowed read-only slices instead of materializing Python lists or per-point objects.
Compiled drawing and layout
Coordinate mapping, tick selection, and geometry are computed in Rust rather than in Python-level artist objects.
Direct encoding
Raster buffers are encoded by the Rust image and PNG/WebP crates; vector output is serialized to SVG or PDF without a Pillow conversion.
Embedded font data
The bundled DejaVu Sans and Geist faces avoid host font discovery and fontconfig parsing during rendering.
Parallel subplot panels
Panels can be rendered concurrently with Rayon, and unchanged figures reuse their encoded output.
Small runtime surface
The extension does not import matplotlib or Pillow, which reduces process startup and memory overhead for batch jobs.
OS: Linux (x86_64)
Python: 3.14.4; matplotlib: 3.10.7+dfsg1; Matplotvite: 0.5.0
Measured: 2026-11-09 12:39:06 UTC
Reproduce:
python tools/benchmark.py